

What We Mean
Three Terms, Briefly
- Observability
- A high-resolution picture of your plant. You do not just see that it has stopped; you can answer why from the recorded data. That is why Pulse keeps every sampled value, not only the latest one.
- Alerting
- A fault becomes an incident automatically, and Pulse notifies the people responsible. If nobody acknowledges, it escalates step by step. The incident stays documented from the first alert through to resolution.
- Security
- Cybersecurity, not machine safety. Pulse keeps an inventory of your devices and continuously checks it against published security advisories. Every finding is rated and tracked through to closure.
At a glance
Platform
Three Jobs, One Platform
What usually takes three tools works on the same data here. No point solutions, no integration projects.
Observability
Close to the machine — and every value is kept.
- Native OPC UA and Siemens S7: Pulse reads straight from the controller, with no additional software and no adapters. Plus any Prometheus-compatible endpoint.
- Every sampled value is kept — the complete history of your plant, retained for as long as you configure.
- Query it freely with PQL, the built-in query language: pick aggregations, filter by line or machine, and group. Pulse chooses the right time resolution itself.
- Anomaly detection: Pulse learns what normal looks like for each machine and raises an incident when behaviour drifts — no threshold to guess.
Alerting
Whoever is responsible gets alerted. If nobody responds, it escalates.
- Faults become incidents automatically — nobody has to raise the alarm by hand.
- Conditions, not just single thresholds: rules relating several data sources, modelled visually.
- Service level objectives: set a target and a rolling window for a condition — Pulse tracks the error budget and alerts when it burns down too fast.
- Multi-step escalation chains and on-call schedules with rotations and substitutions.
- Voice call, SMS, push and email, with acknowledgement straight from the message.
Security
Device inventory and vulnerabilities in one tool.
- Asset register: every station your scans find, with address, order code and the modules inside it — plus owner, criticality and lifecycle.
- Pulse continuously matches your device inventory against current security advisories, including the CSAF feeds from CERT@VDE and around 40 vendors.
- Every finding carries a CVSS score, advisory detail and a recommended action. You triage it, and the decision stays on record.
Anomaly Detection
Inventory and measurements: holding both is the difference
Most monitoring tools have one or the other: a device inventory that never sees a measurement, or a historian that has no idea what produced the number. Pulse holds both — only that makes anomaly detection possible.
Your device inventory
Every station your scans find — with address, order code and the modules inside it, and the vulnerabilities that apply to them.
Your measurements
Every sampled value, kept: history from every OPC UA and S7 source you connect, at whatever time resolution your question needs, for as long as you configure.
Anomalies, caught early
Pulse learns what normal looks like for each machine and raises an incident when behaviour drifts — no threshold to guess and no rule to maintain. And the alert already knows which asset it is about.
Inside the Product
A Look Inside Pulse
Straight from the product — no mockups.
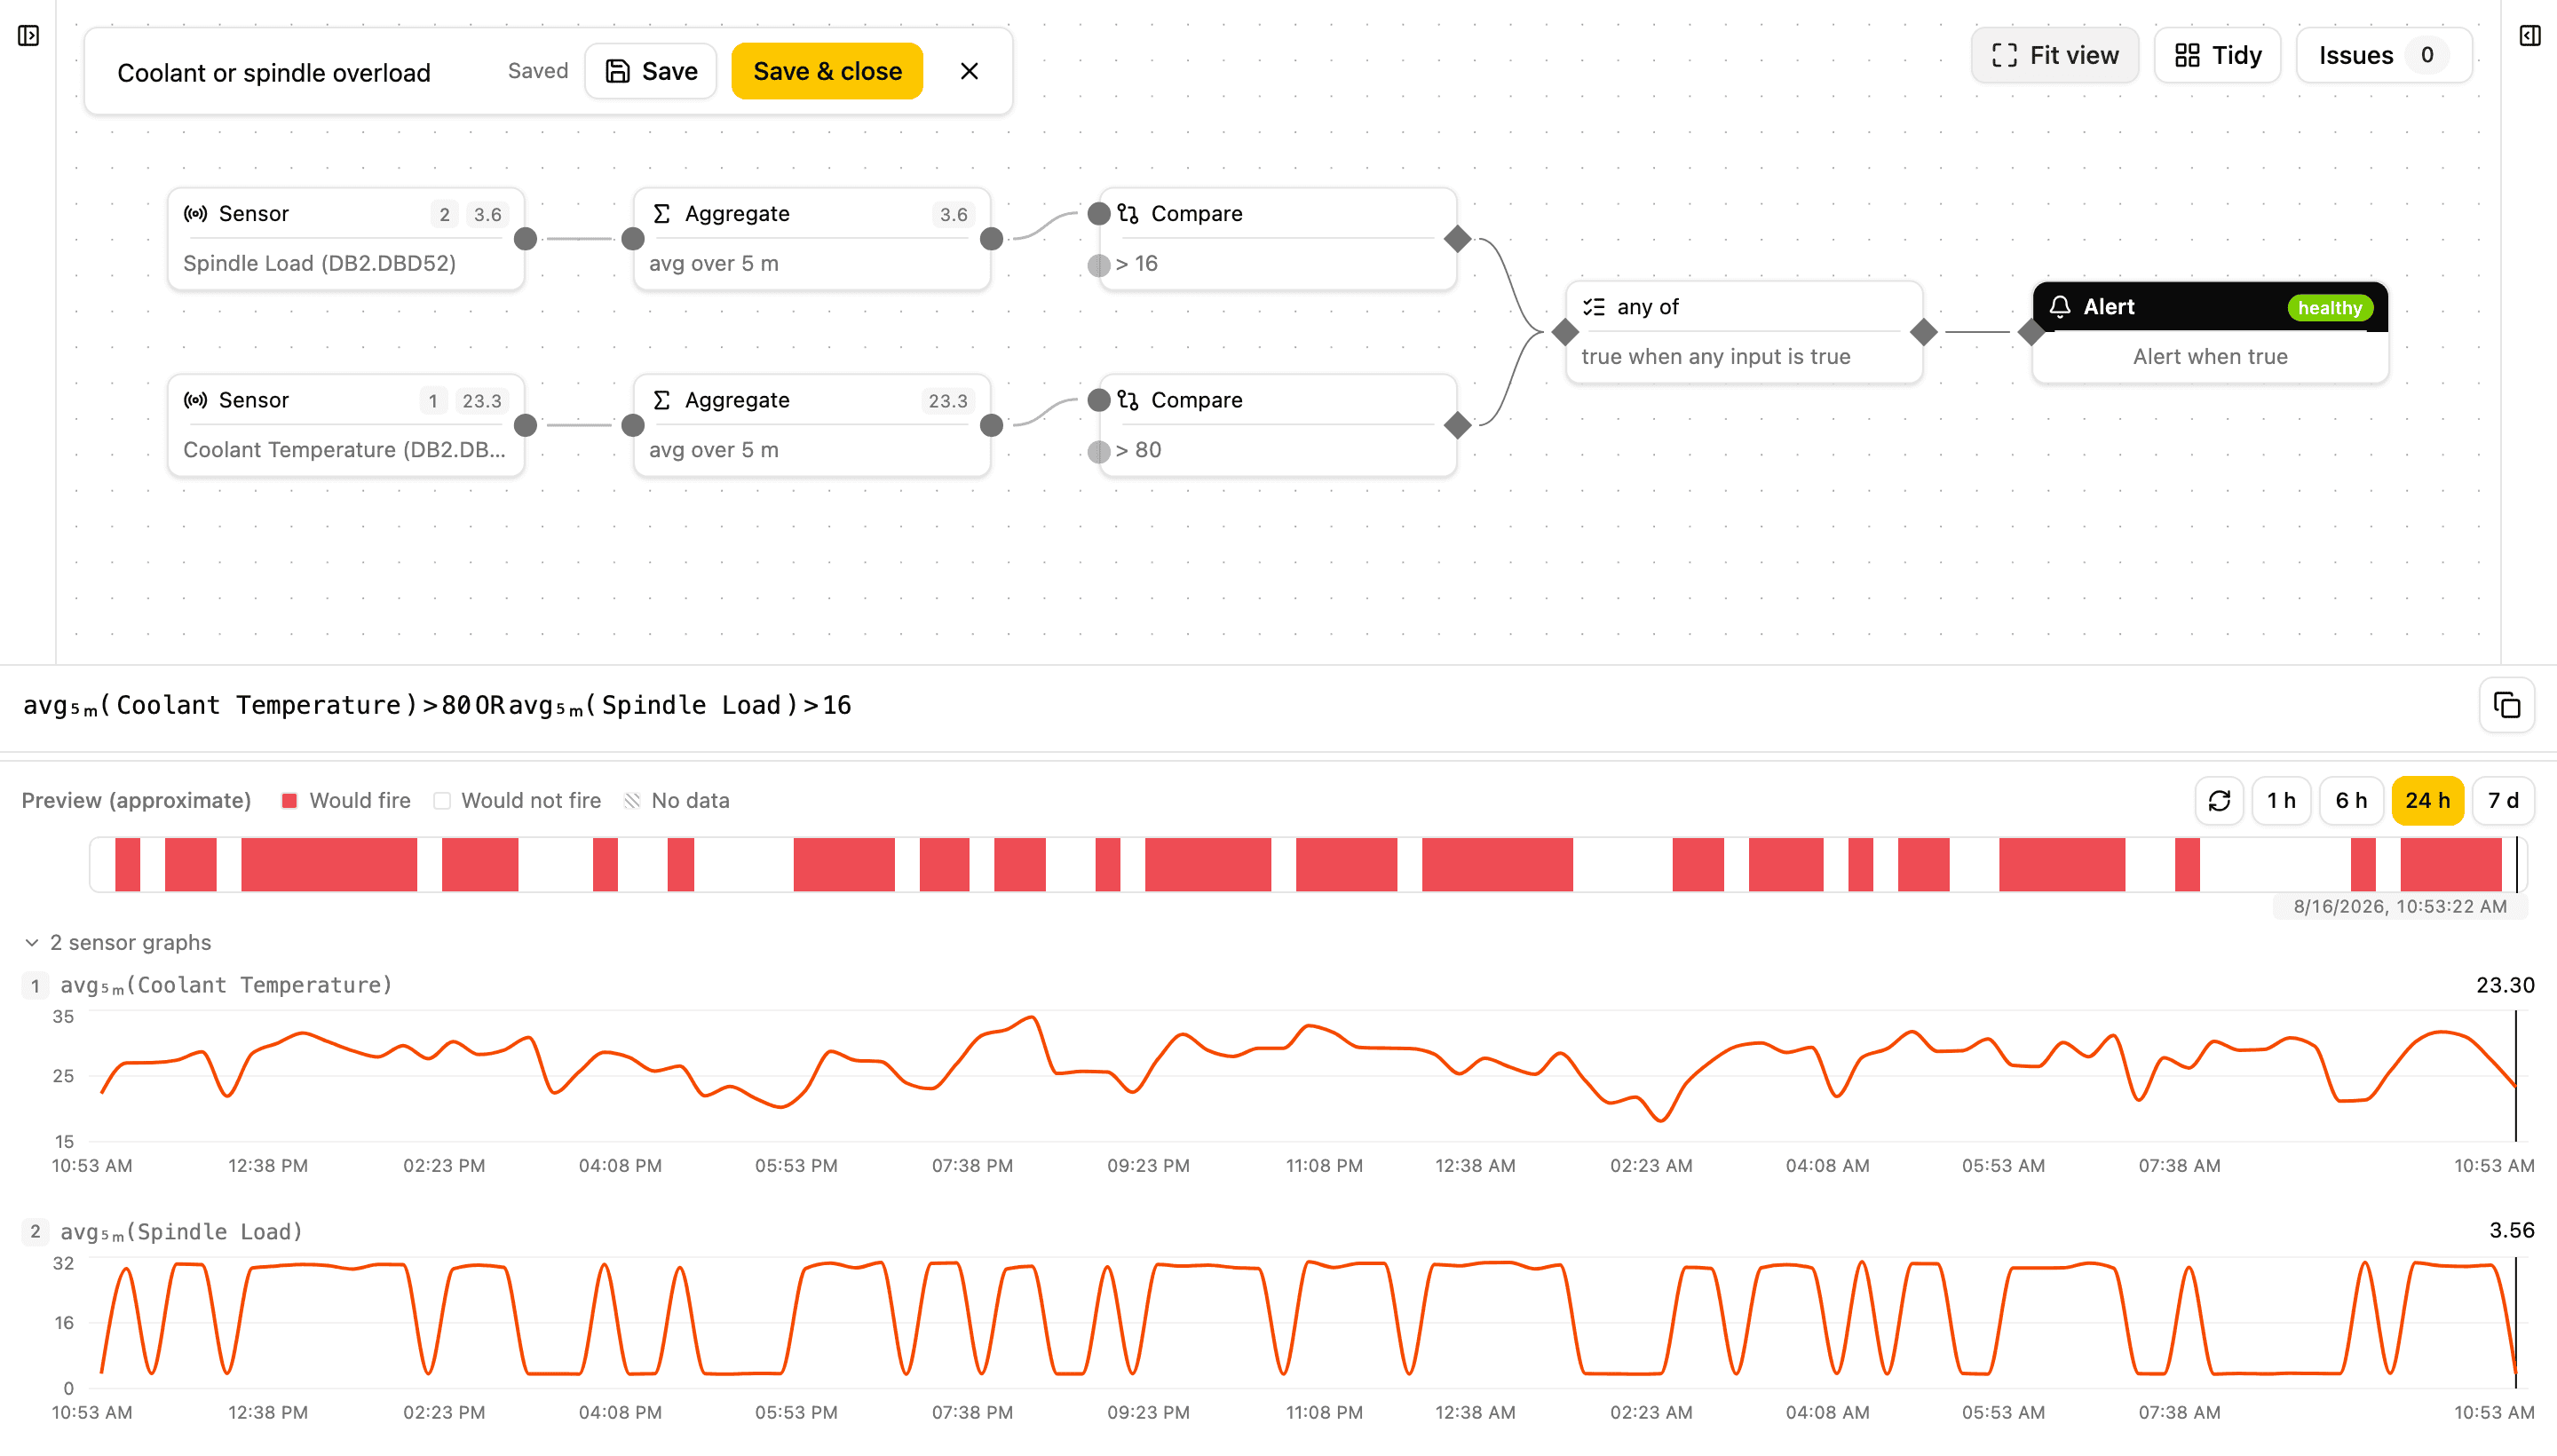
Model conditions, not just thresholds
In the condition editor you combine several data sources into one rule — a visual graph that shows how your data points relate. When the rule fires, an incident is opened. And when readings are missing, Pulse reports “Unknown” rather than an all-clear.
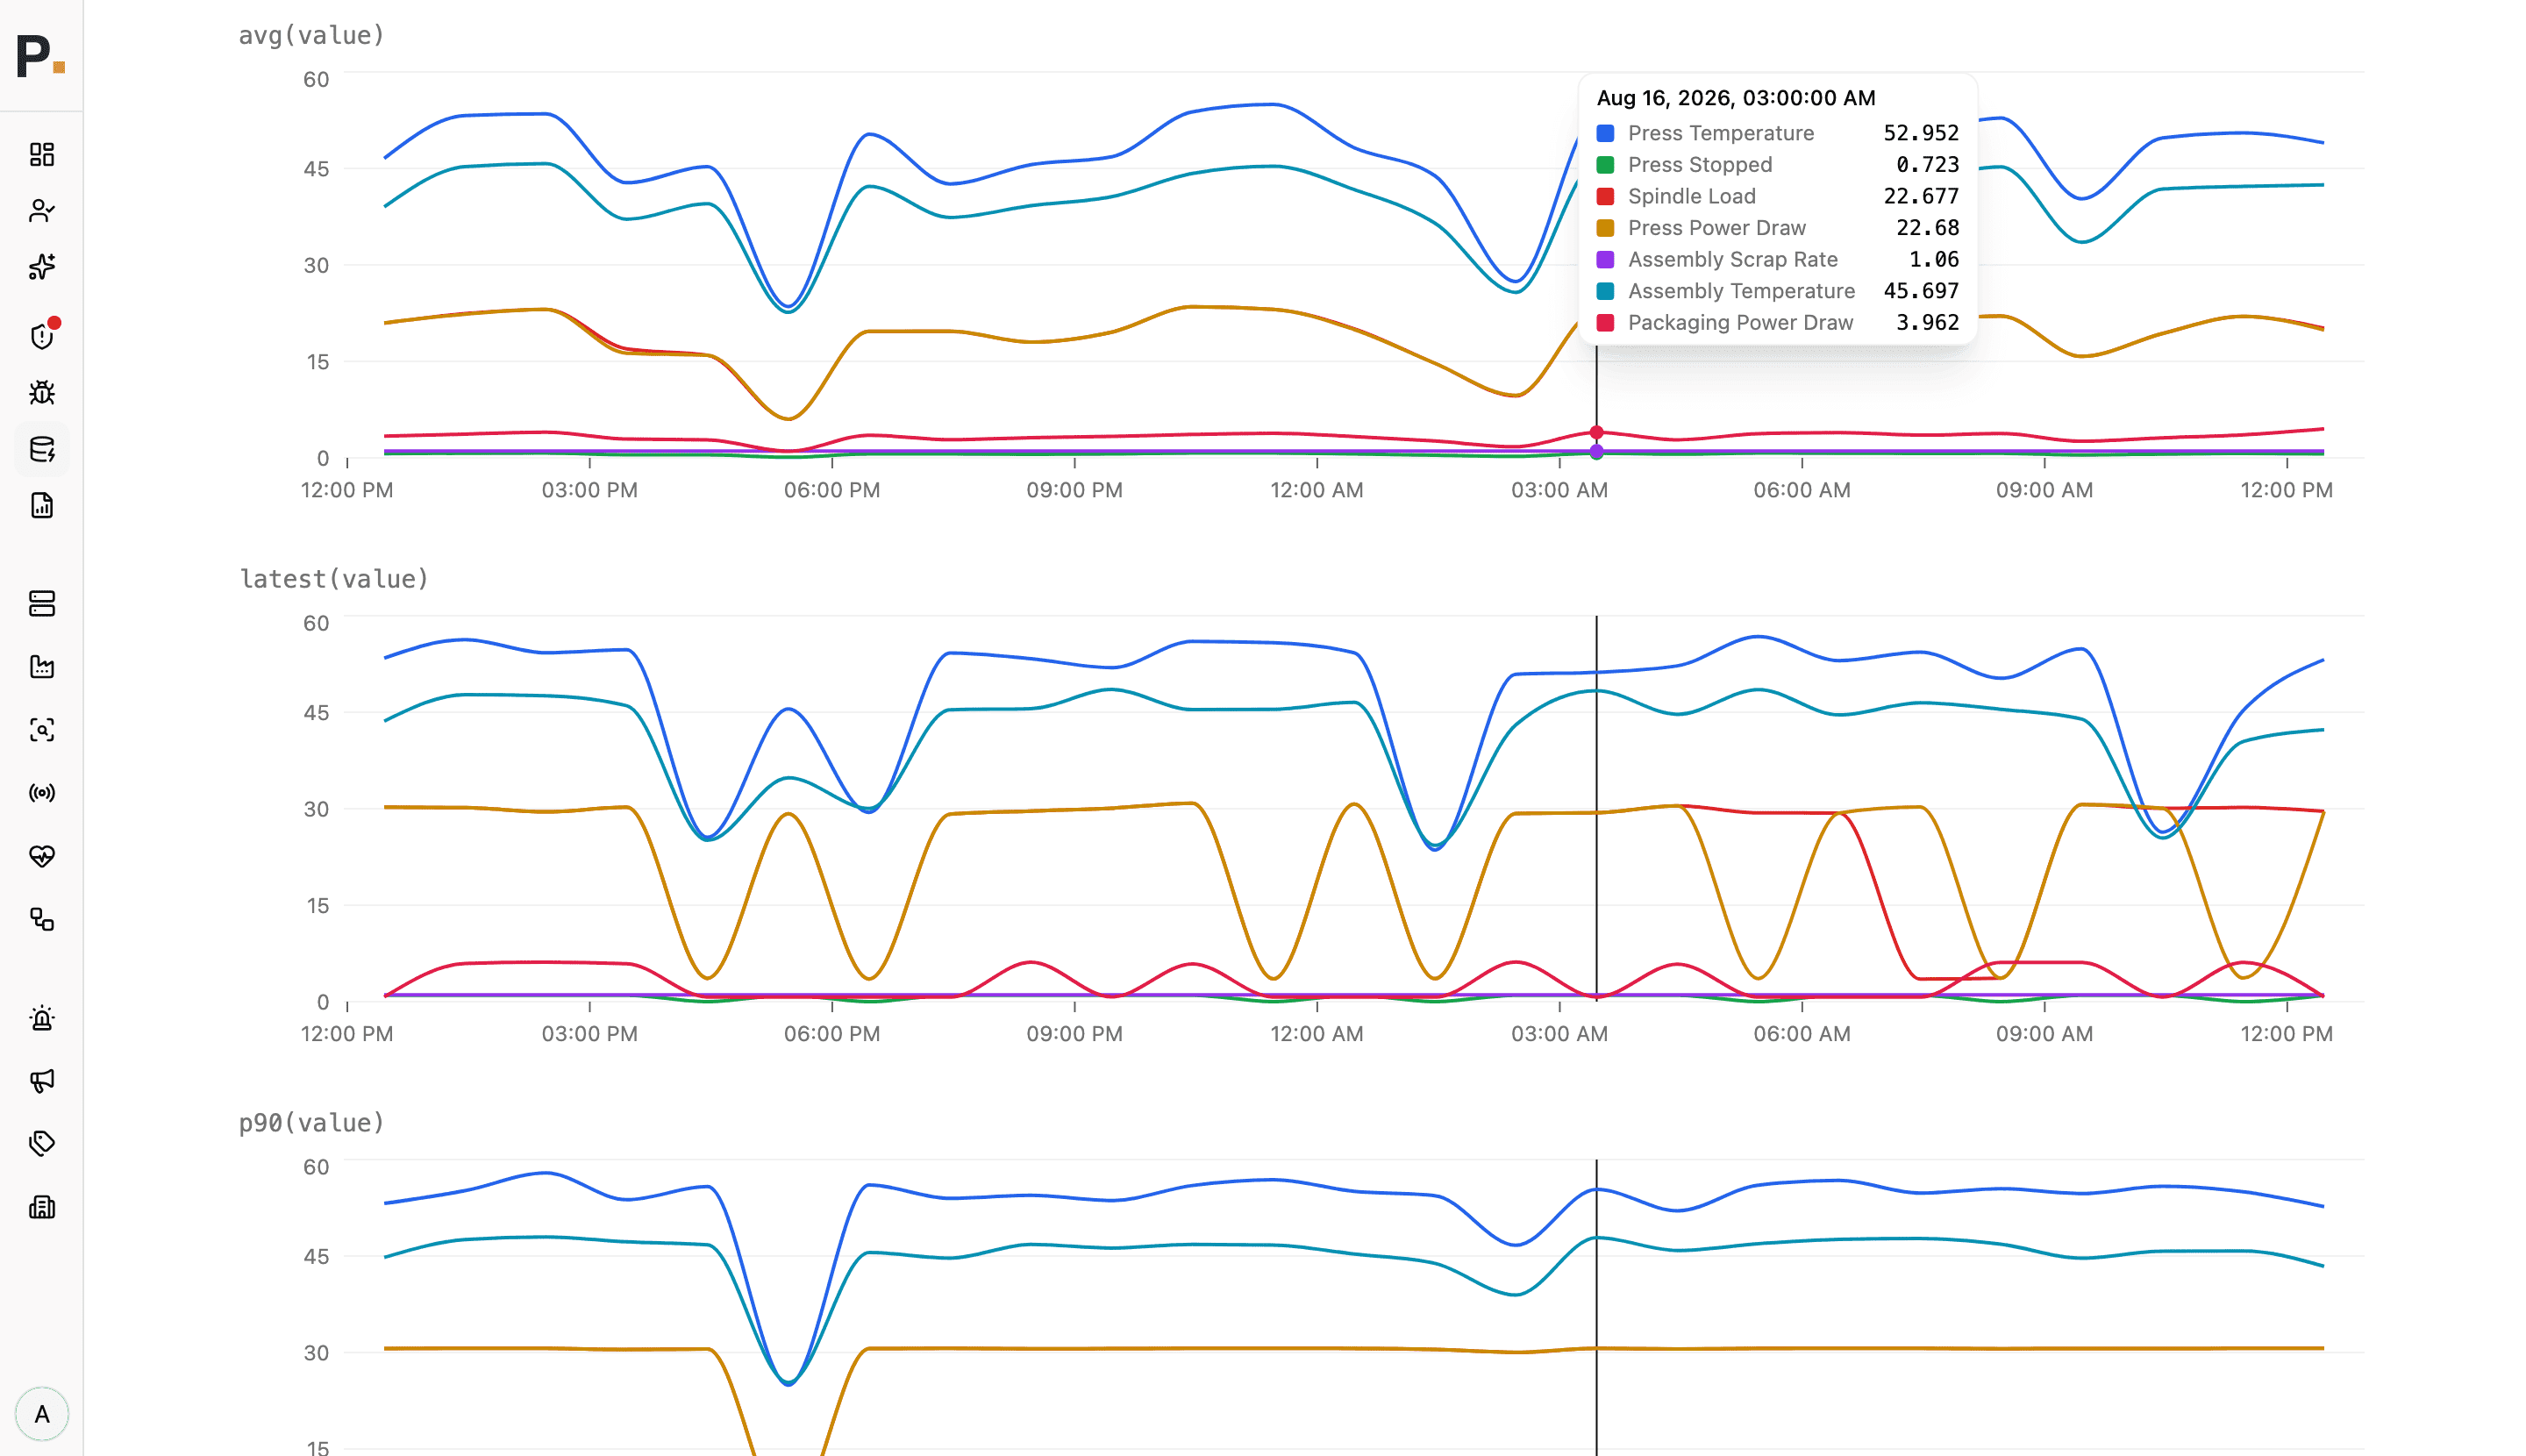
Your process history, free to query
Pulse keeps every sampled value: your process history in one place, retained for as long as you configure. You query it with PQL — pick aggregations, filter by line or machine, group; Pulse chooses the time resolution itself. Analysis that used to take a data team and a warehouse of its own — here without either.
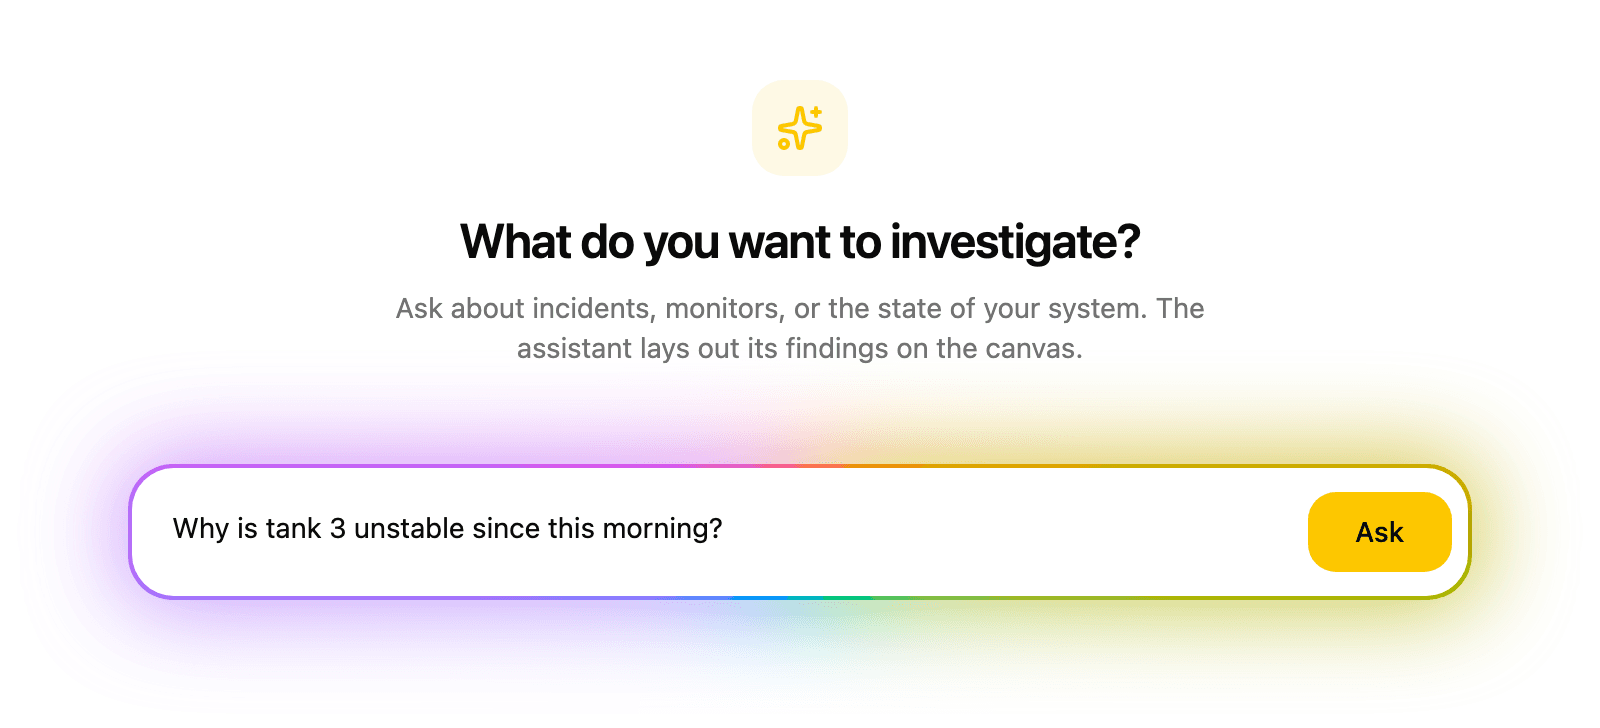
Ask your equipment, in plain language
The optional AI assistant answers questions about monitors, incidents, measurements and vulnerabilities in plain language, with no query language needed. Results land on a canvas as interactive cards and charts; one click takes you to the monitor, incident or finding behind any of them. Countermeasures come back OT-appropriate rather than as generic IT advice. An MCP adapter lets you connect a model you run yourself or a commercial AI service to Pulse.
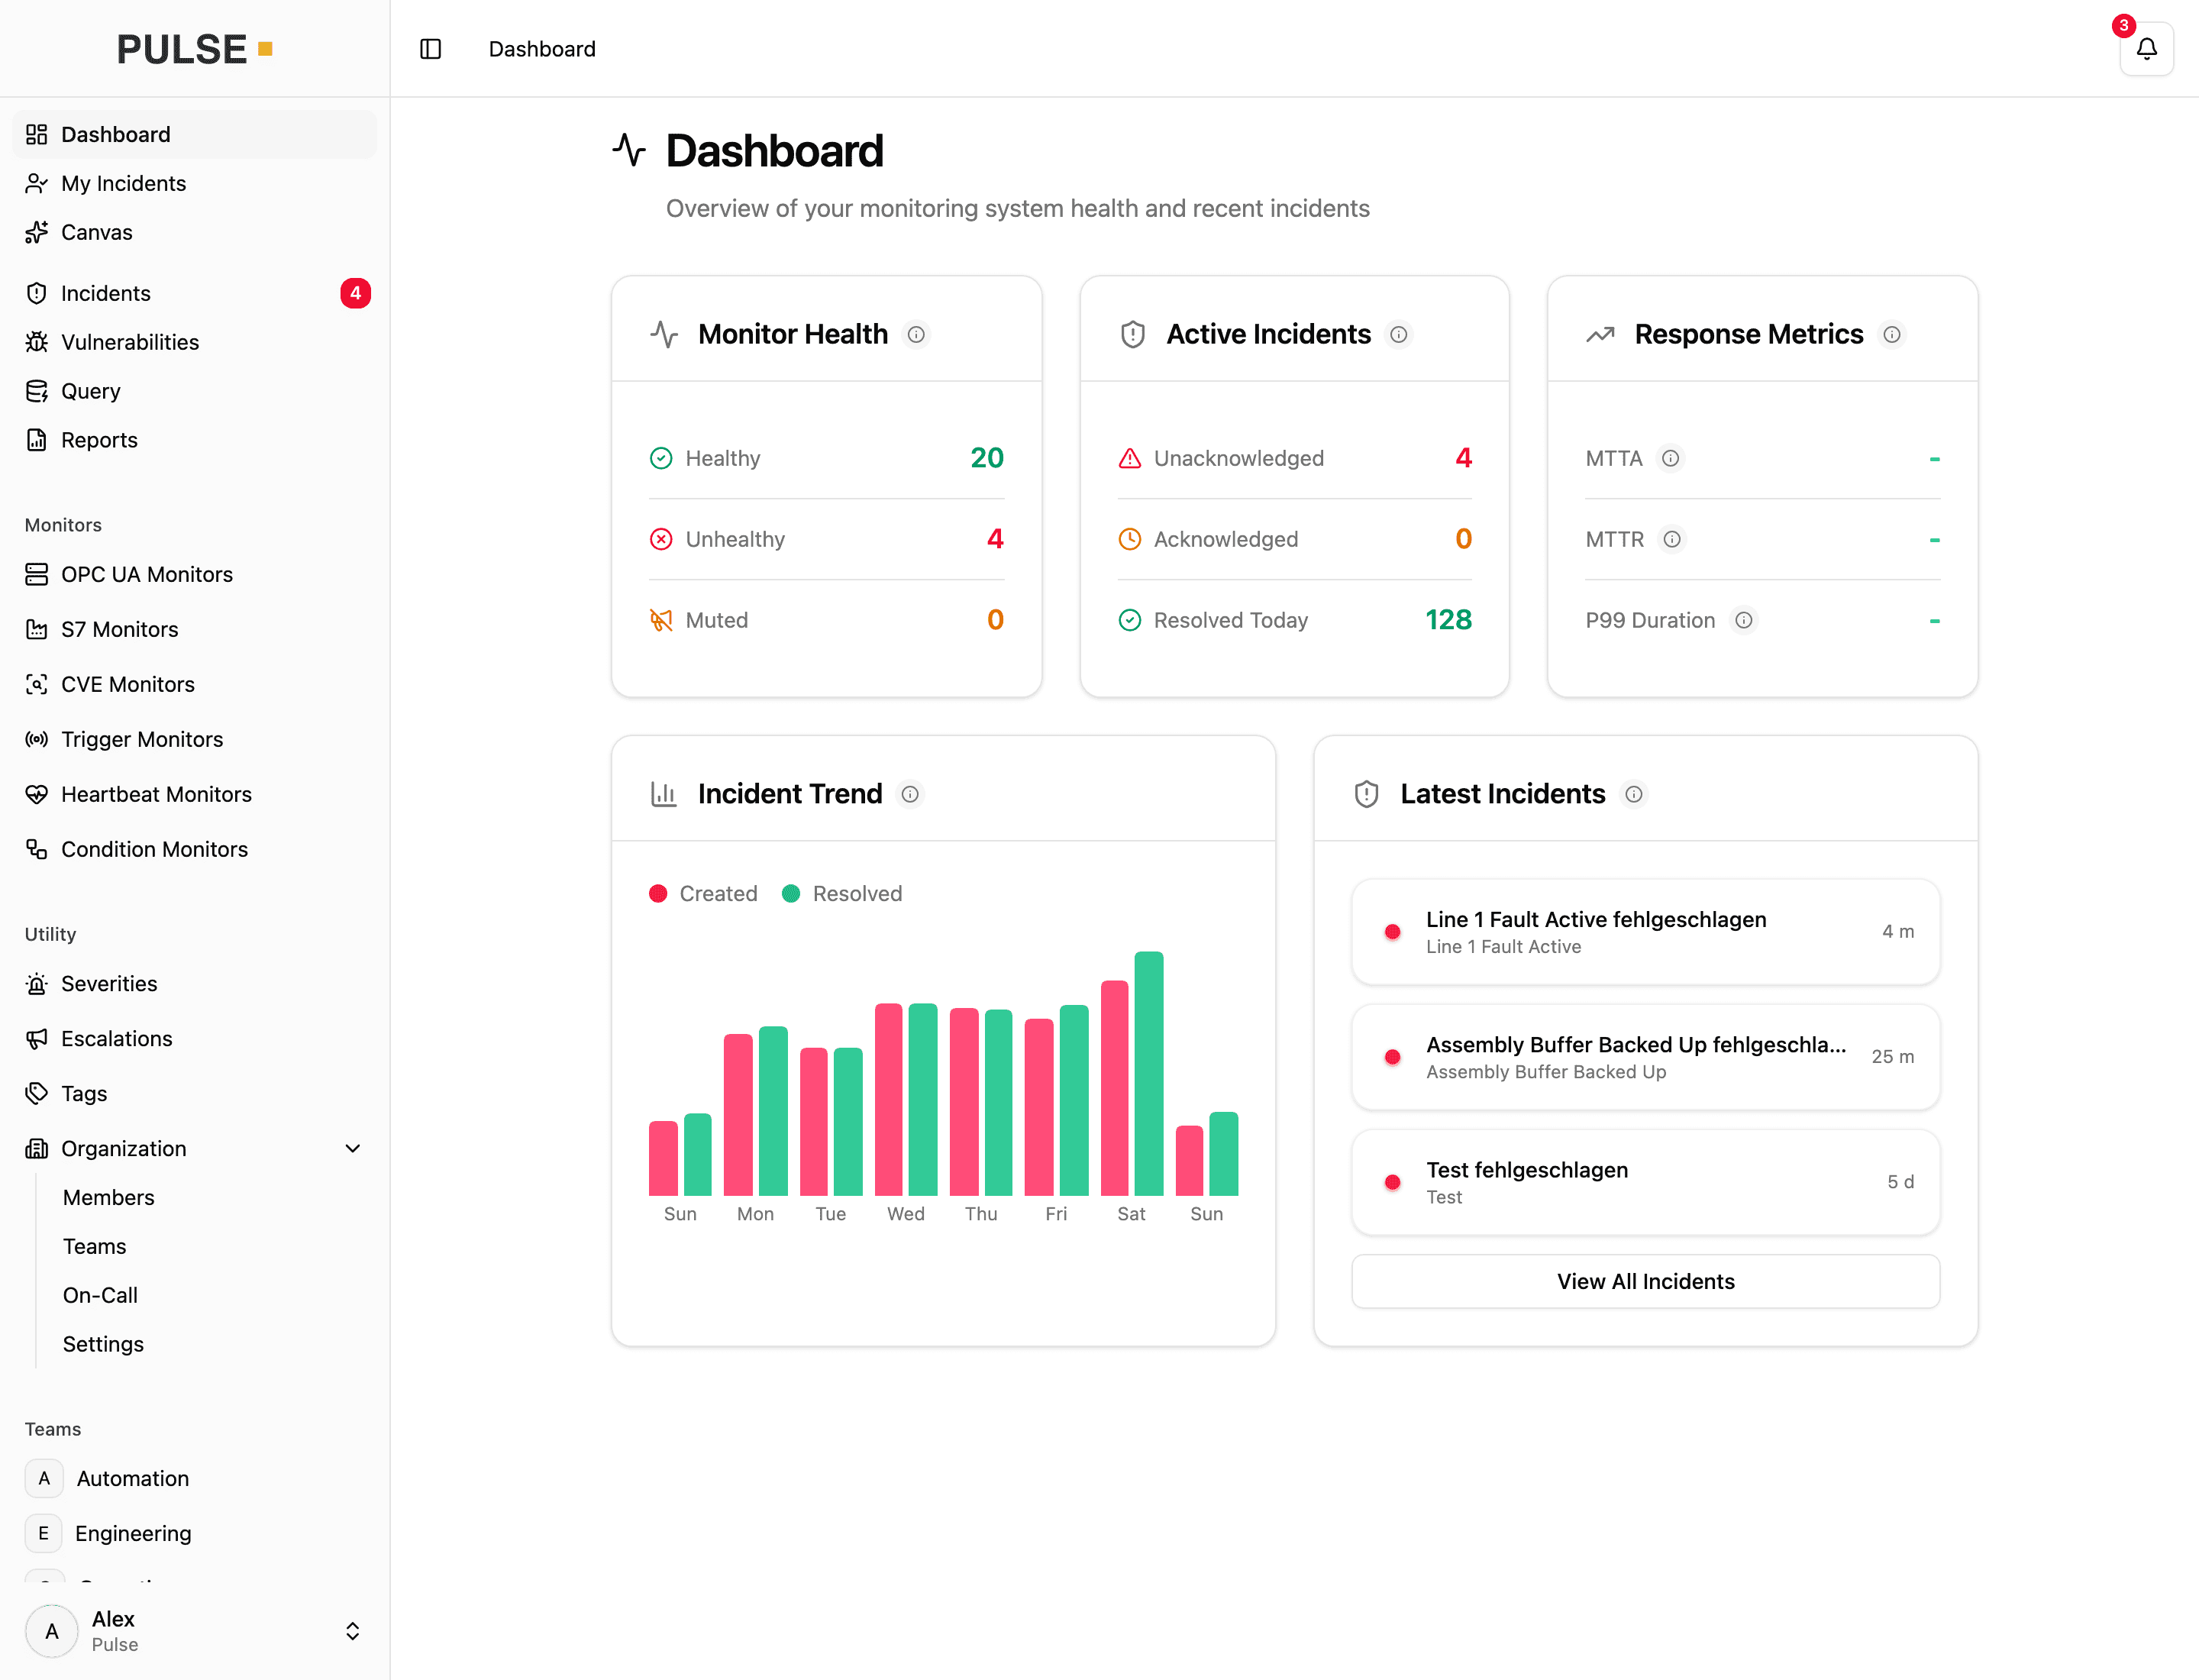
Every signal, the same incident workflow
OPC UA and S7 tags, Prometheus metrics, known device vulnerabilities, webhook triggers, heartbeats, service level objectives, and composed conditions — all monitored the same way, all feeding the same incident workflow. Pulse grows with whatever you connect next — you will not need a second tool for it.
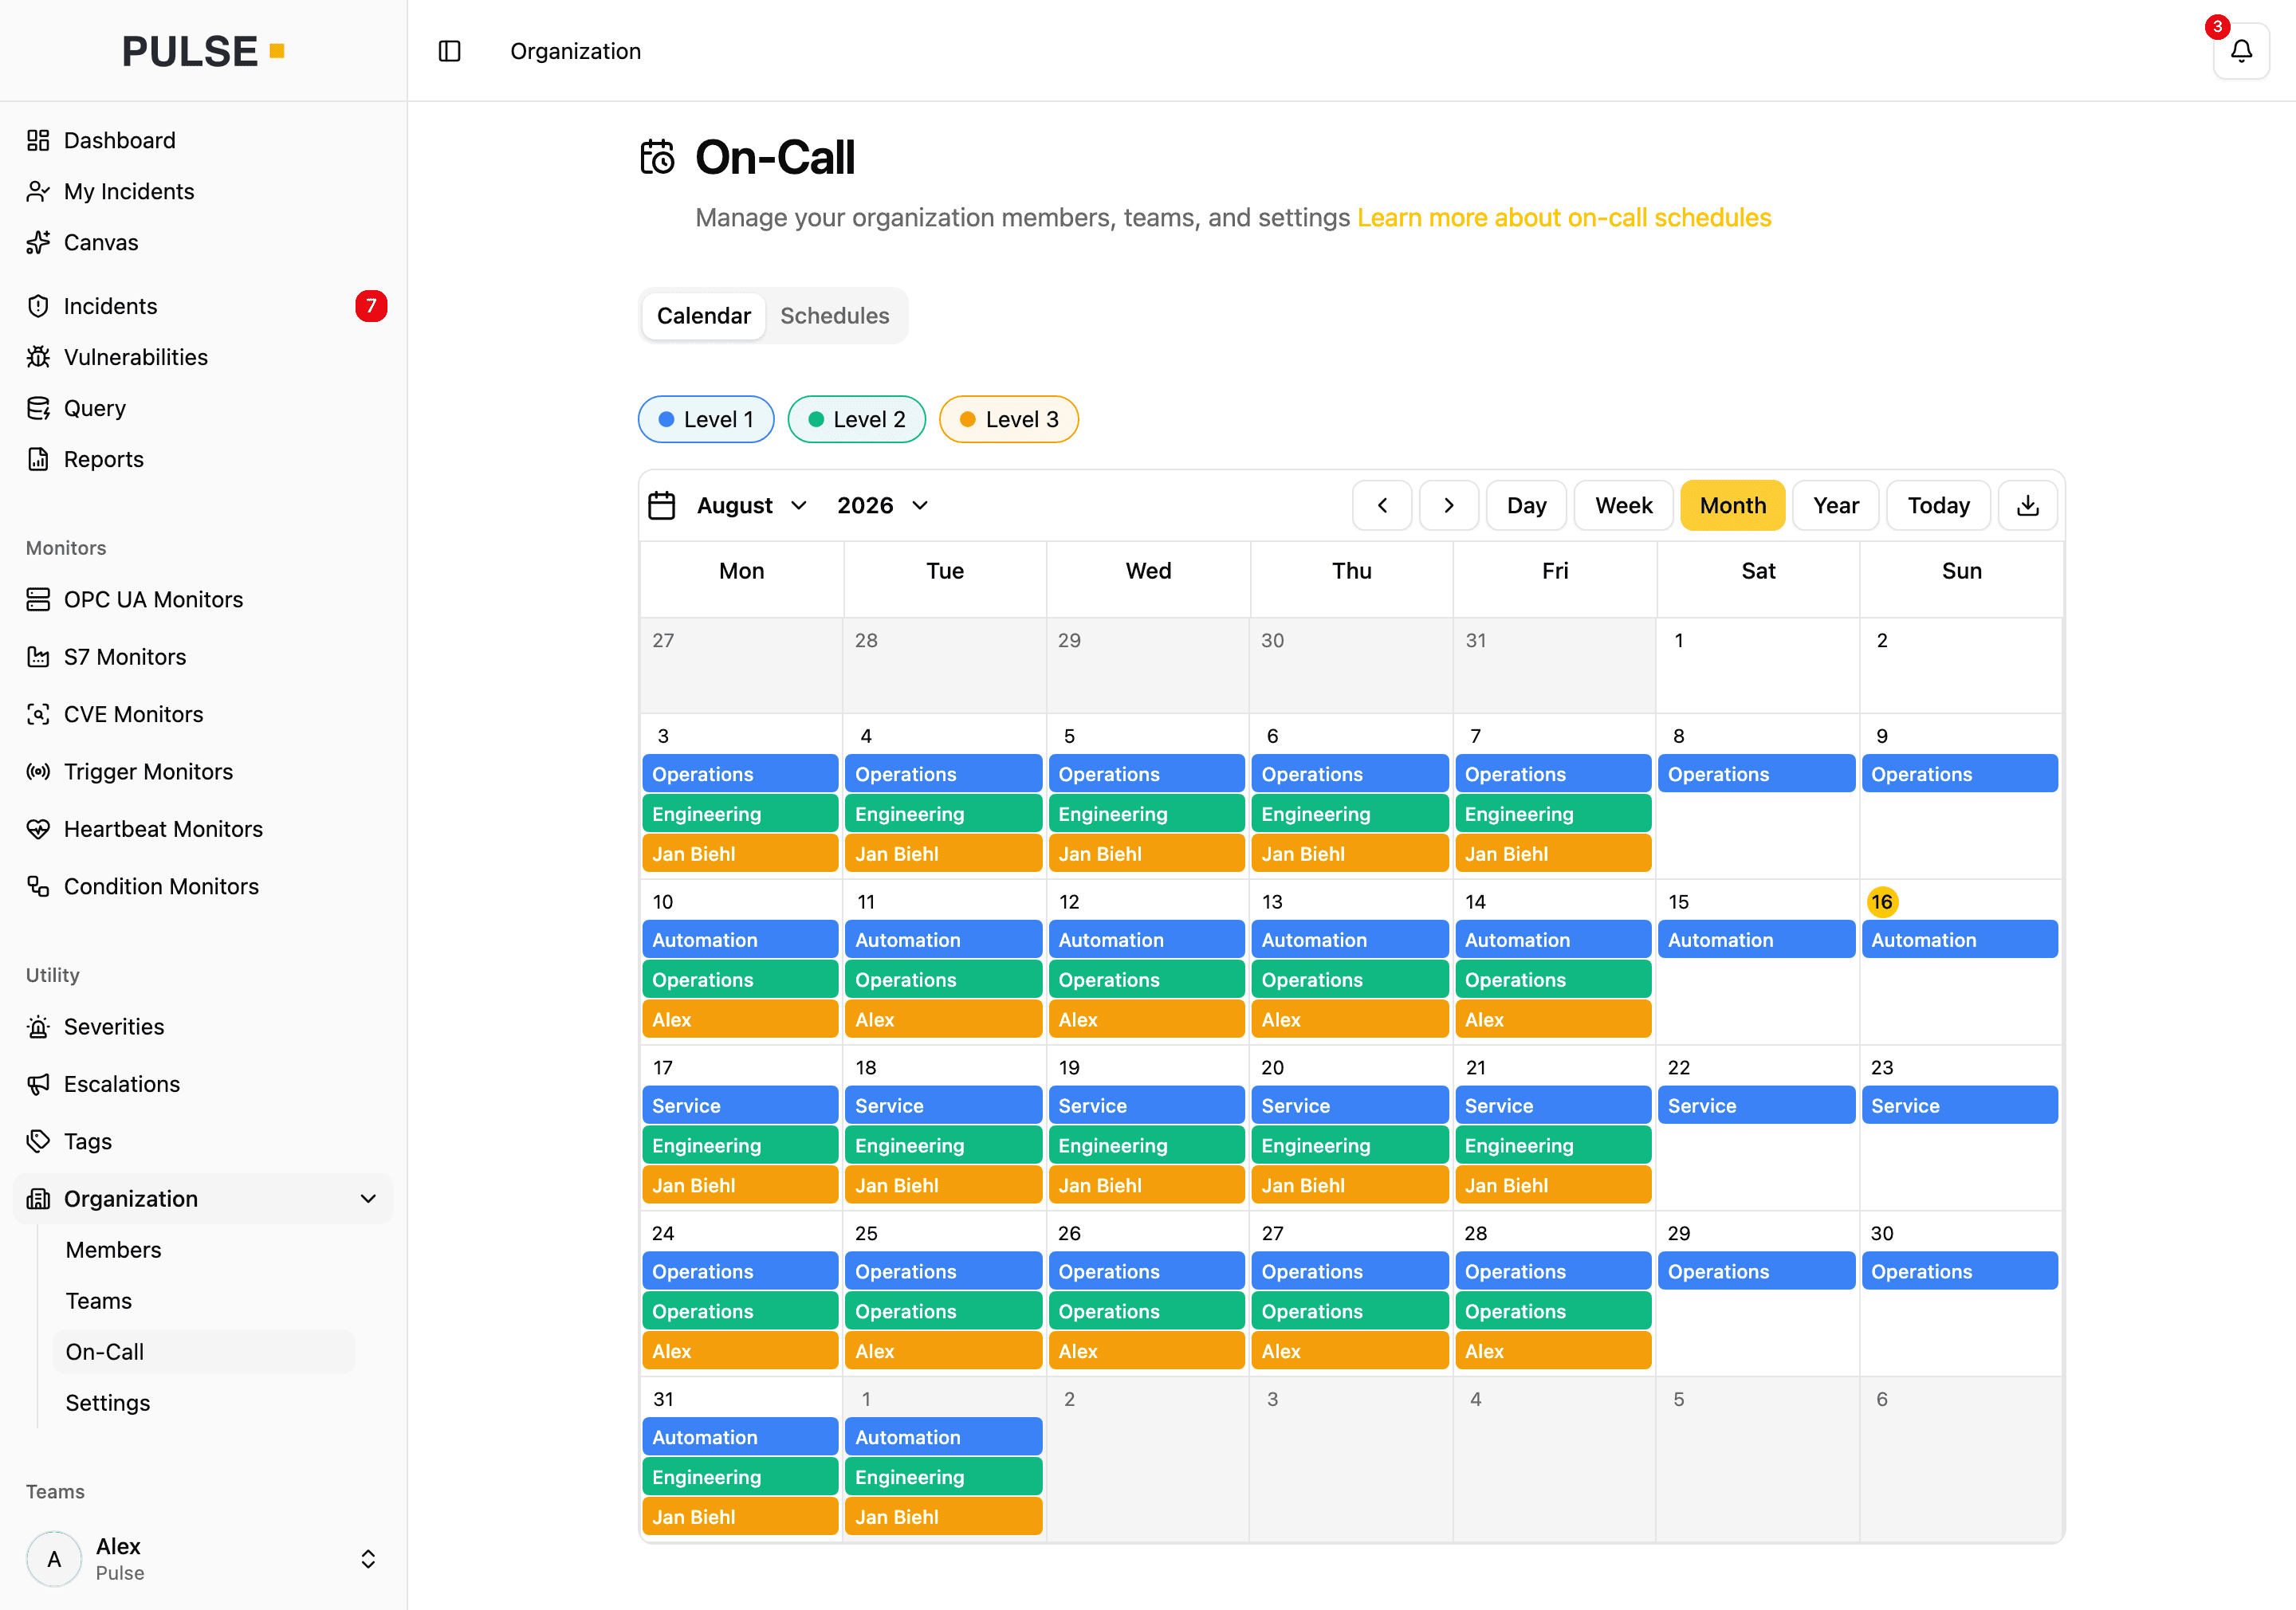
Who gets woken up, decided in advance
On-call schedules are built in: rotations per team or per person, layered into escalation levels and visible to everyone. When a monitor fails at three in the morning, Pulse already knows who to call — and who to call after that.
Connectivity
Speaks the Protocols of Your Equipment
Native support for the plant floor — no additional software, no adapters, no interface projects.
OPC UA
Endpoints and nodes with security modes and policies, authentication, and certificate pinning. Plus Alarms & Conditions.
Siemens S7
Direct communication with S7 controllers — rack/slot configuration, data types from bit to real.
Prometheus
Any Prometheus-compatible metrics endpoint, scraped on its own interval — gateways, edge devices and IT systems monitored beside the plant floor.
Device Discovery
Scan a network range you enter for Siemens S7, OPC UA and PROFINET devices — order number, firmware and serial, ready to add as a data source. PROFINET devices are found and inventoried; readings come over OPC UA and S7.
REST API
Systems that already evaluate alarms — control rooms, SCADA, material flow computers — report them straight to Pulse. Reading and intake can be combined.
CSV Import
Bulk onboarding of entire plant inventories: create measuring points from a CSV file instead of one by one.
Safe for Your Plant
Read-Only by Design
Pulse never writes to your controllers. It reads only the values you point it at, and looks for devices only when you tell it to. And if Pulse ever stops, your production carries on unchanged.
No writes to your controllers
Pulse reads process data. It never writes to a controller and never changes a configuration.
Scans only when you say so
Monitoring touches only the endpoints you configure. Device discovery is a separate action that an administrator has to start, on a network range you enter — and a scan never turns a device into a data source by itself.
Independent of production
Pulse observes the systems it monitors without becoming part of them. Nothing on the line depends on Pulse to run.
Verified connections
Signed and encrypted OPC UA connections, sign-in by user or certificate. With certificate pinning, Pulse notices when an endpoint is no longer the one you trusted.
Encrypted in transit
TLS throughout, with certificate management built into the appliance.
Role-based access
Every action in Pulse belongs to a named account with a defined role, on the record.
Vulnerability Management
Known Vulnerabilities in Your Devices — Tracked Automatically
Pulse continuously matches your device inventory — vendor, order number, firmware version — against current security advisories, including CSAF feeds from CERT@VDE and around 40 vendors. Every applicable vulnerability shows up as a finding with CVSS score, advisory details, and a recommended action.
- Triage in clear states: open, in progress, resolved, not affected, or accepted risk with a follow-up date
- Affected-devices view: the reach of a CVE across all your equipment at a glance
- Every decision stays documented with its history
Regulation
What NIS2 and the Cyber Resilience Act now require
Two regimes reach the factory from different directions: NIS2 binds many operators of their own plant, and the Cyber Resilience Act binds manufacturers placing products with digital elements on the EU market. Both expect known vulnerabilities to be handled systematically and the decisions documented — which is what Pulse records anyway.
- Since 11 September 2026, manufacturers of products with digital elements must report actively exploited vulnerabilities and severe incidents; Regulation (EU) 2024/2847 applies in full from 11 December 2027.
- That duty covers vulnerabilities in the components you build in, too — Pulse flags it when an advisory affects one of them.
- Every triage decision stays on record — valuable support for your security and compliance processes, for example in the NIS2 and CRA context.
Operations
Two Ways to Run It — Neither Is an IT Project
Pulse runs as a turnkey appliance in your own network, or as a hosted service with a collector at each site. Either way, you work with it in the browser — nothing is installed on workstations.
Turnkey Appliance
Pulse as one machine in your own network, installed from an ISO image and managed through a guided interface — no Linux skills required.
- Readings, monitor configuration and tags never leave your network
- Works without internet access, with email via your own mail server
- Remote collectors reach segregated zones — the connection is always opened from inside the zone, never into it
- Signed updates with automatic backup and rollback
- Interface and documentation in German and English
Pulse Cloud
The hosted service. A small collector at each site reads your machines from inside your own network and opens one connection outward.
- No server of your own to maintain — we run and update the application
- No inbound rule needed — every connection is opened from the inside
- The only thing that talks to your machines sits in your network
- Several sites in one view — the appliance cannot do this
- The full app from anywhere, without a VPN
Notifications
SMS, voice calls, and app push are delivered through our web services — servers exclusively in Germany, GDPR-compliant.
- Voice call, SMS, push and email, with acknowledgement straight from the message
- Only the alert message reaches the delivery service
- Pulse Dispatch on the App Store, Android in development
Network layout, separate IT and OT networks, and what leaves your network: Deployment options in the documentation →
Documents
Something to pass around the building
Four PDFs for the people who decide with you — maintenance, IT, purchasing. No form, no email address.
Pulse at a glance
Two pages on what it does: catch faults, alert those responsible, keep an eye on known vulnerabilities.
Download — PDF · German
Alerting for your equipment
How a threshold becomes a phone call — escalation chains, on-call schedules and a complete incident history.
Download — PDF · German
The platform in technical detail
Protocols, data retention, operation and interfaces — for the technical review in your own building.
Download — PDF · German
CVE monitoring for OT equipment
The datasheet to hand to your IT or security department, with the NIS2 and IEC 62443 context spelled out.
Download — PDF · German
All four documents are in German. Anything they leave open is best covered in the demo.
See Pulse in Action
30 minutes, live, no strings attached: on a simulated plant, we show you how a fault is detected, escalated, and acknowledged — ideally around your own use cases.
Would you rather read up first? The full product documentation is public.